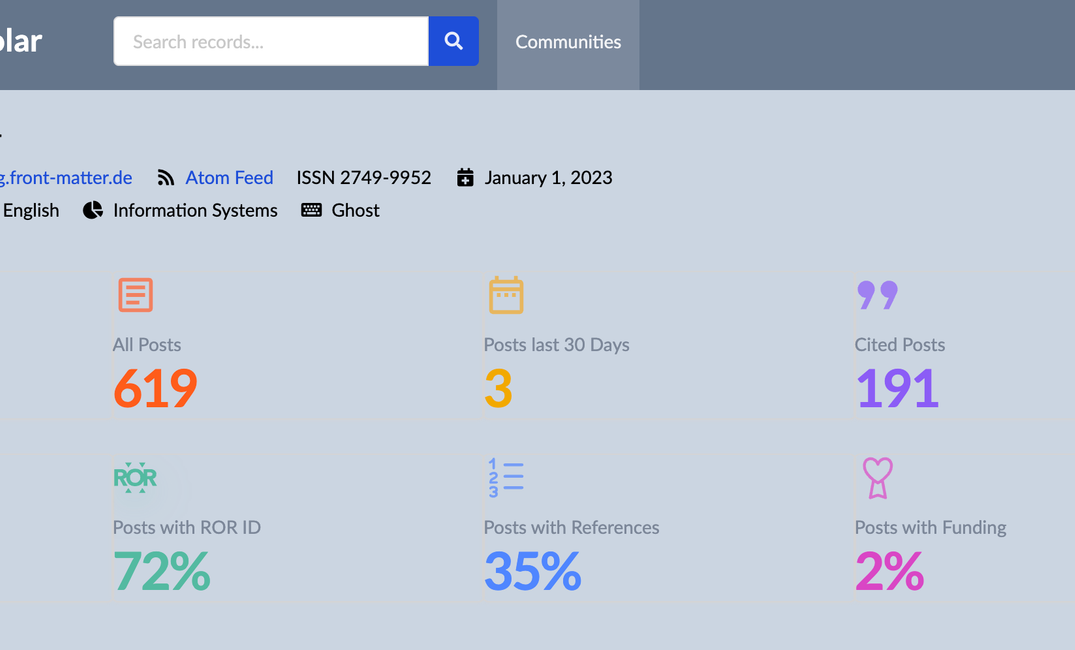
About 12 months ago Rogue Scholar introduced dashboards with summary statistics of the science blogging archive. At the end of 2025 these dashboards migrated to the Rogue Scholar landing page. Today Rogue Scholar is launching community dashboards – showing the same summary statistics by community. This feature works with all types of communities: blog, subject and topic communities.
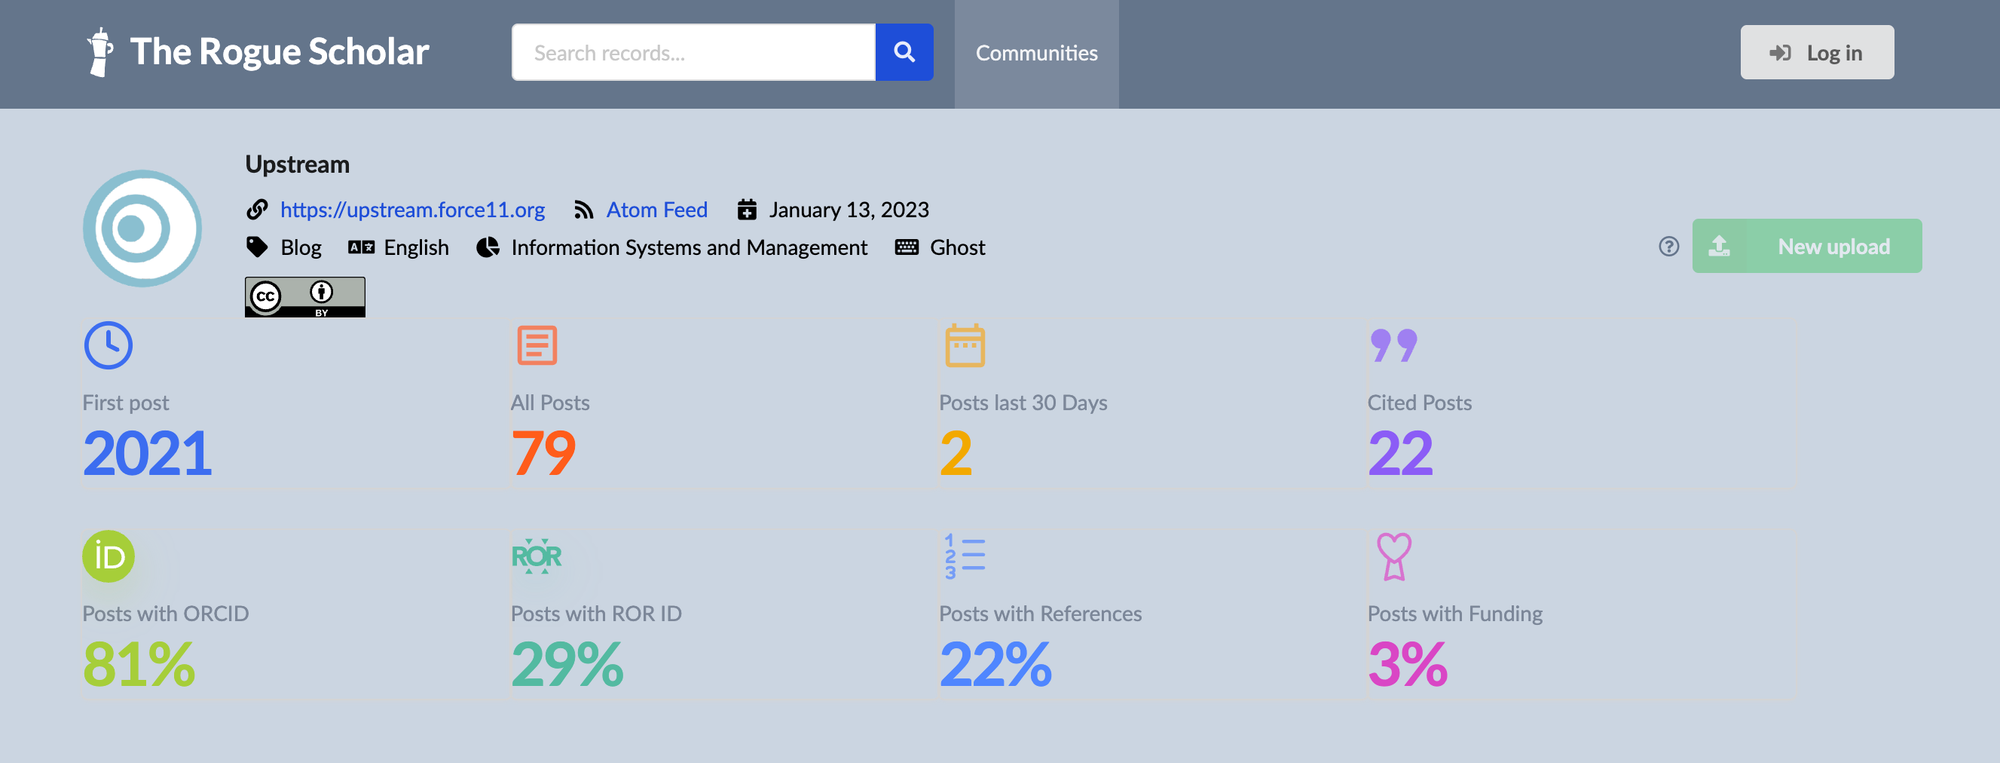
Blog community dashboards help blog authors see major gaps in their metadata coverage, e.g. the percentage of posts that include an author ORCID, ROR for author affiliation, or references. The Upstream blog (where I am one of the editors) for example does a good job including ORCID, ROR and references.
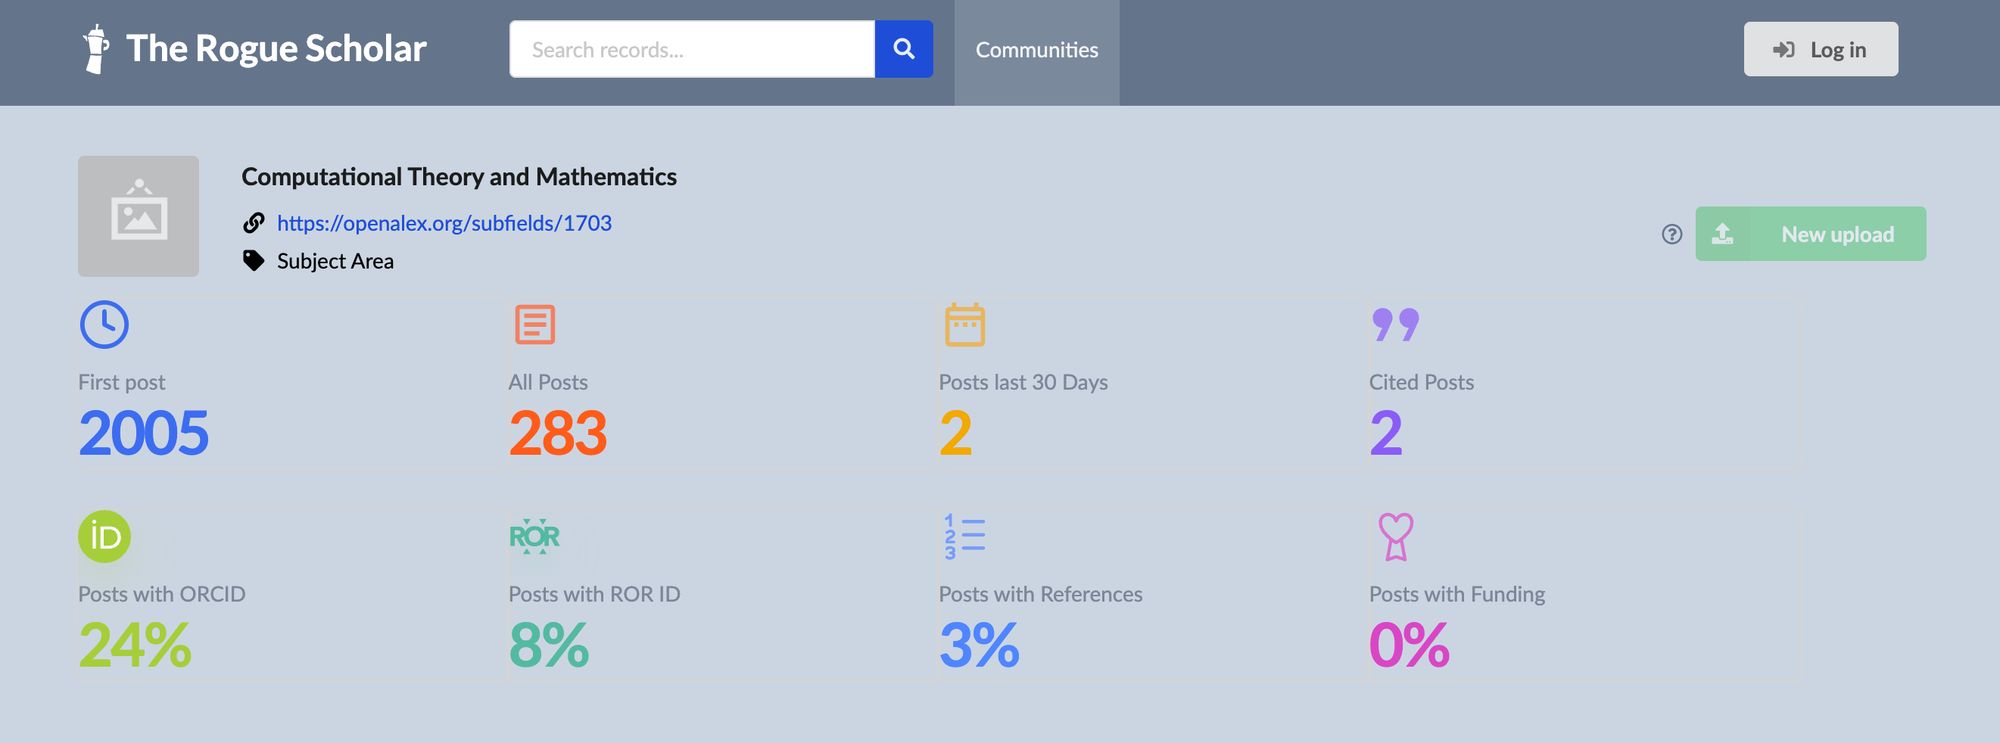
For readers, community dashboards provide an overview of its activities. The Computational Theory and Mathematics Subject Community published two posts in the last month, and the first post in 2005.
As before, these dashboards don't show metadata coverage that is always 100% at Rogue Scholar. All nearly 50,000 blog posts have an open license (CC-BY, a few CC0), all posts have an abstract, all posts have a language, and all posts have a subject classification using the OpenAlex categories.
Please use Slack, email, Mastodon, or Bluesky if you have any questions or comments.
References
- Fenner, M. (2025, March 10). Working on the Rogue Scholar dashboard. Front Matter. https://doi.org/10.53731/wtvvs-f4h04
