
Running scholarly infrastructure such as Rogue Scholar beyond the initial launch phase – what is typically called Day 2 operations – requires the following activities:
- monitoring
- incident management
- maintenance and updates
- scaling
As Rogue Scholar is self-hosted infrastructure the natural fit for these activities is self-hosted observability frameworks. One central element is the Grafana dashboard monitoring service health:
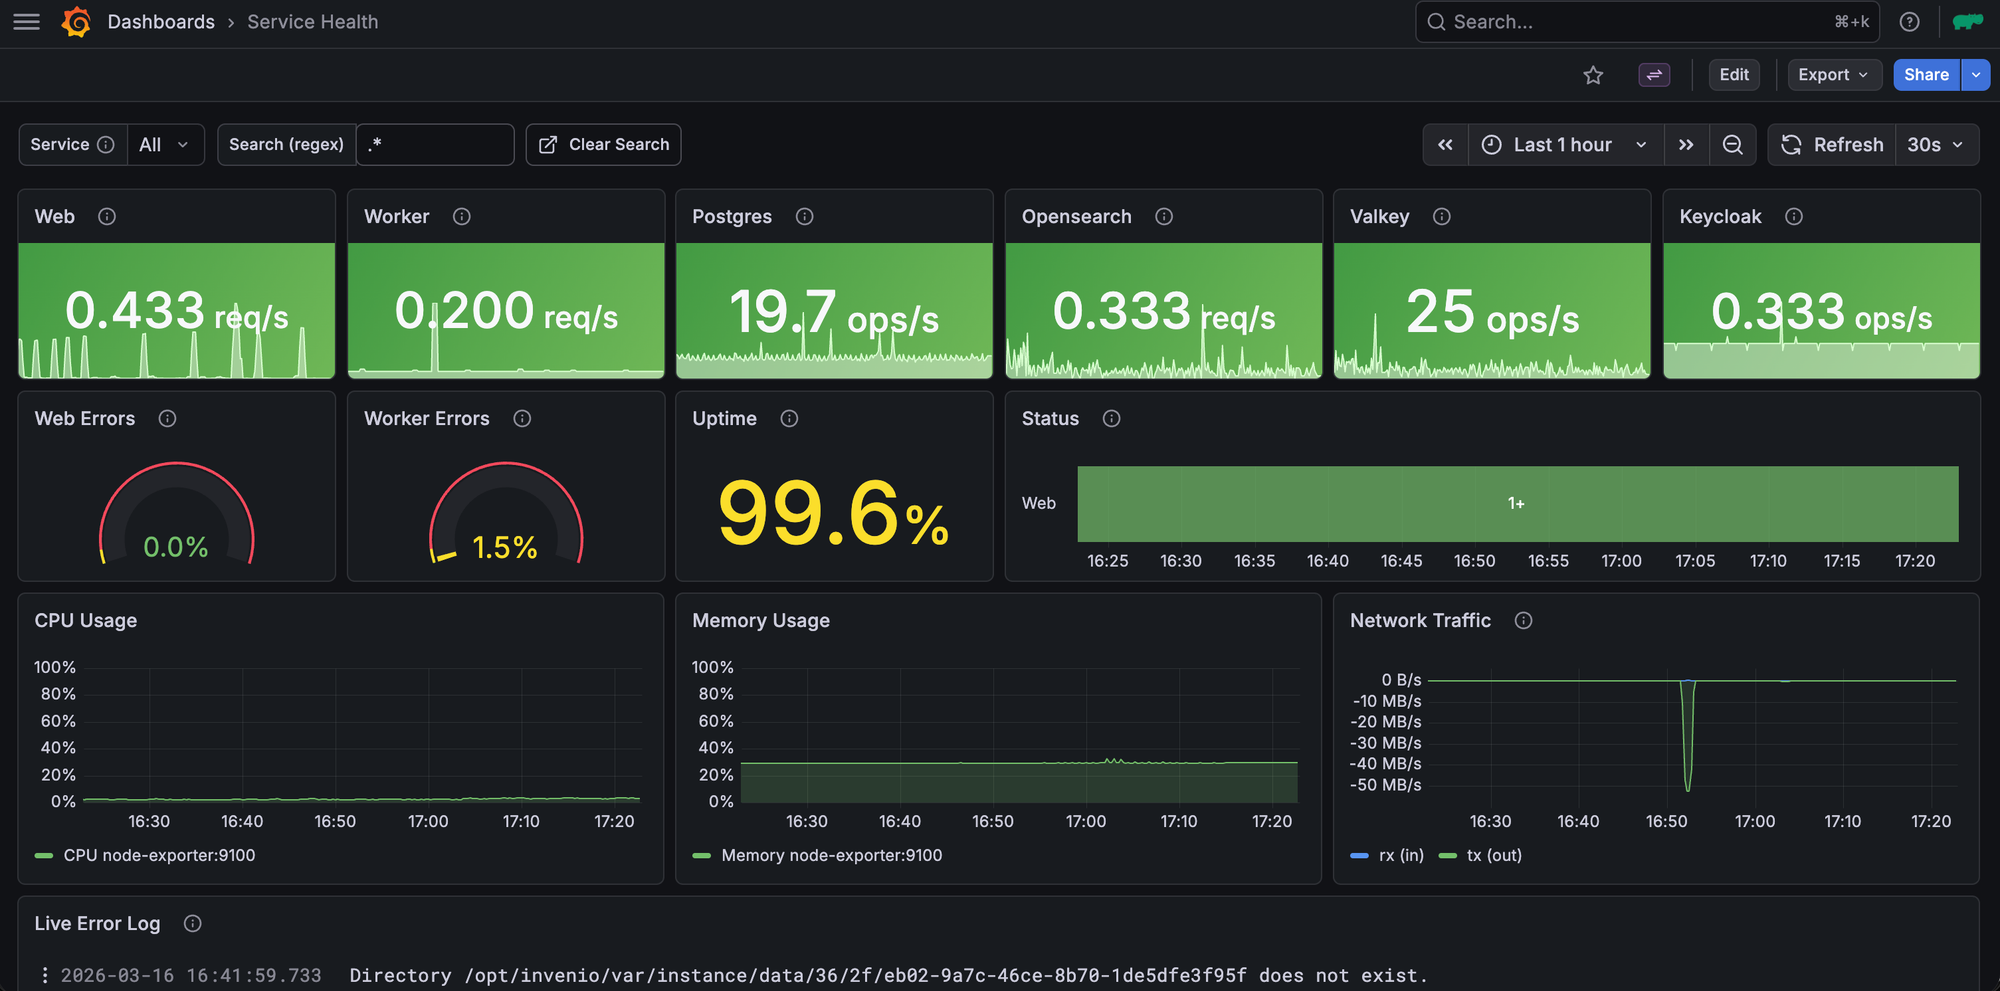
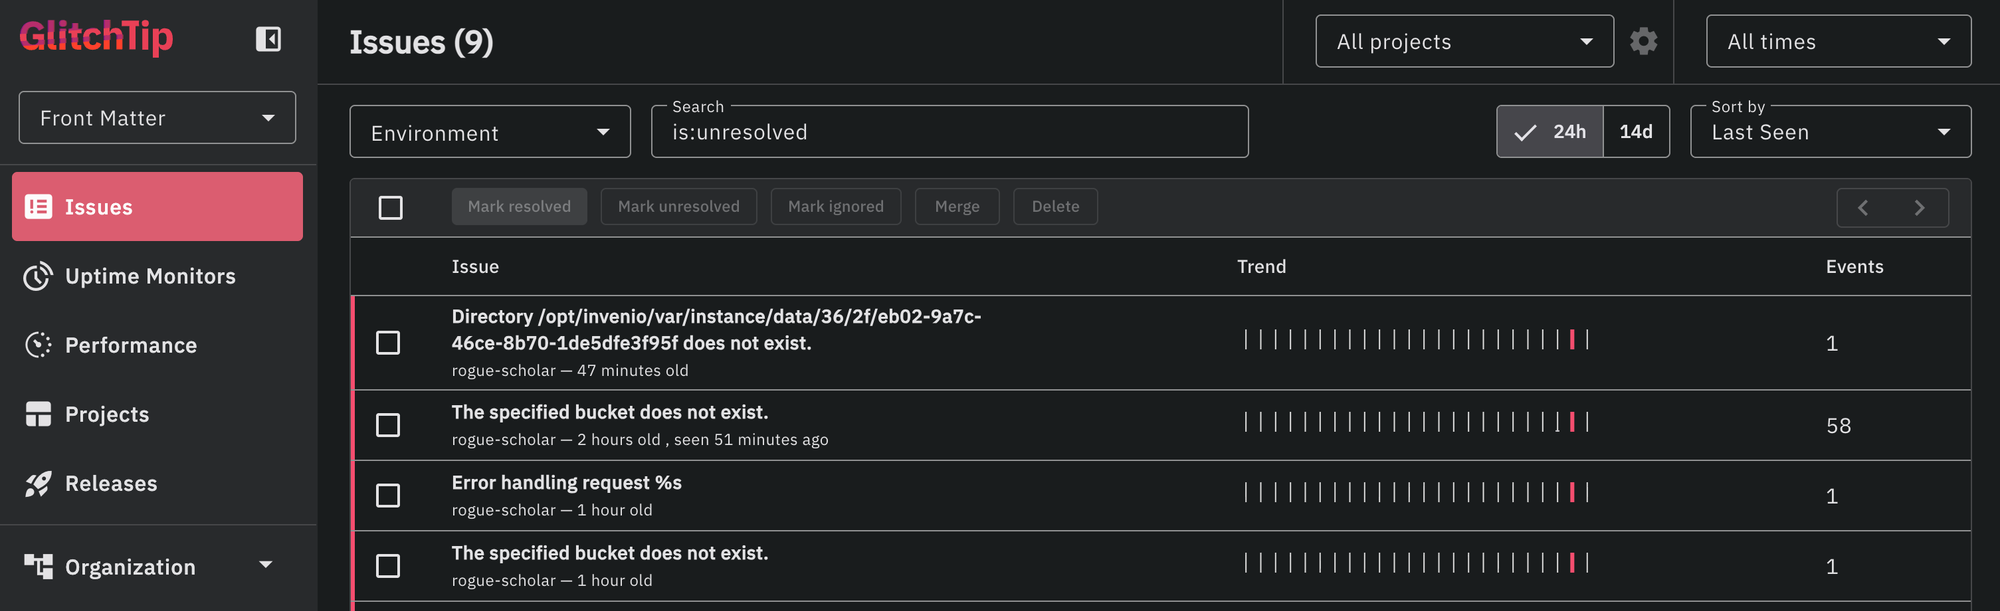
The dashboard collects metrics (ViktoriaMetrics) and logs (ViktoriaLogs) from the InvenioRDM respository platform that powers Rogue Scholar, and monitors the service availability from an external uptime monitor. Errors are sent to the self-hosted GlitchTip service using the Sentry integration built into InvenioRDM.
Standard prometheus metrics were added to InvenioRDM using the prometheus-flask-exporter library, and log files for the InvenioRDM web and worker services are generated in structlog JSON format and reformatted into ViktoriaLogs format using Vector.
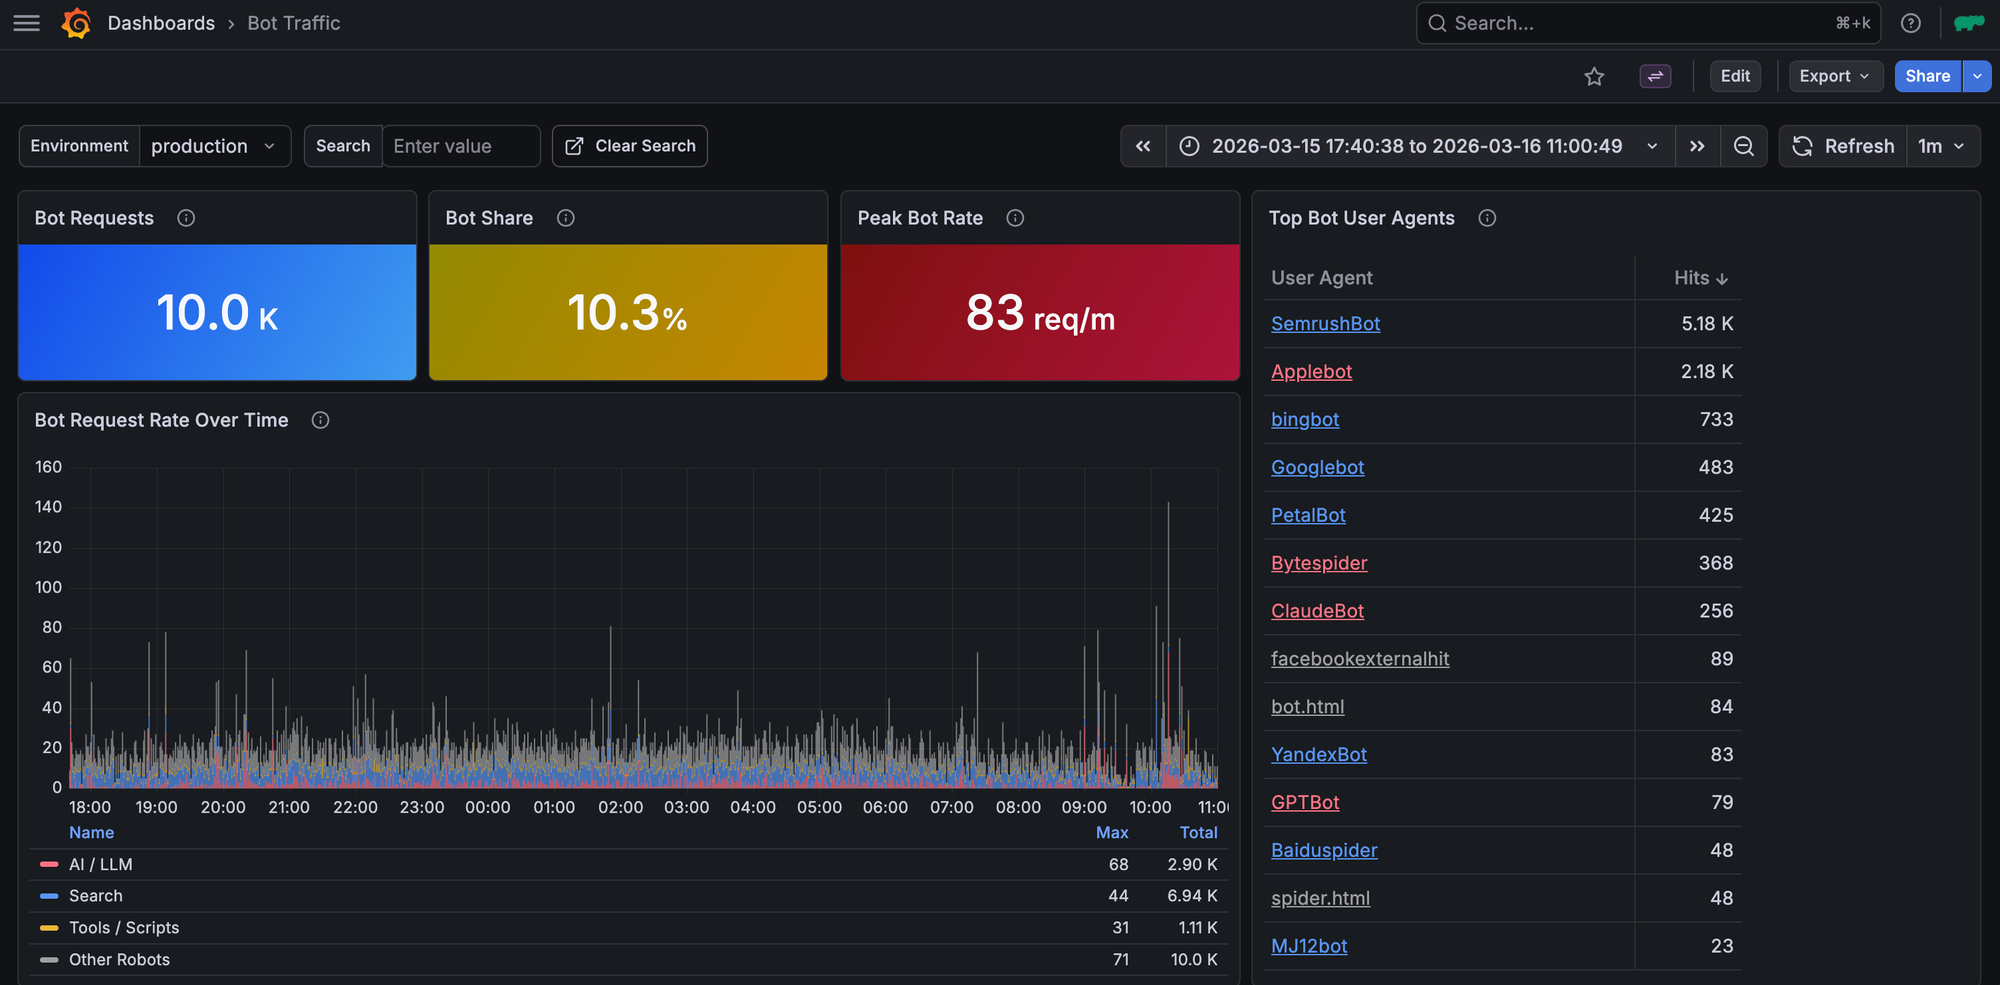
This new infrastructure not only simplifies monitoring service health, but also makes easier specific investigations, for example exploring the bot traffic Rogue Scholar receives each day:
Future work could include more detailed monitoring of celery workers or a dedicated dashboard for authentication and access monitoring.
The Rogue Scholar observability service is generic enough to be useful for any InvenioRDM repository instance, uses self-hosted open source software, and can be deployed via the included Docker Compose file. The source code is available at https://github.com/front-matter/invenio-observability, for question send an email or reach out via the inveniosoftware Discord Forum.
Please use Slack, email, Mastodon, or Bluesky if you have any questions or comments.
